
Show Of Hands asked:
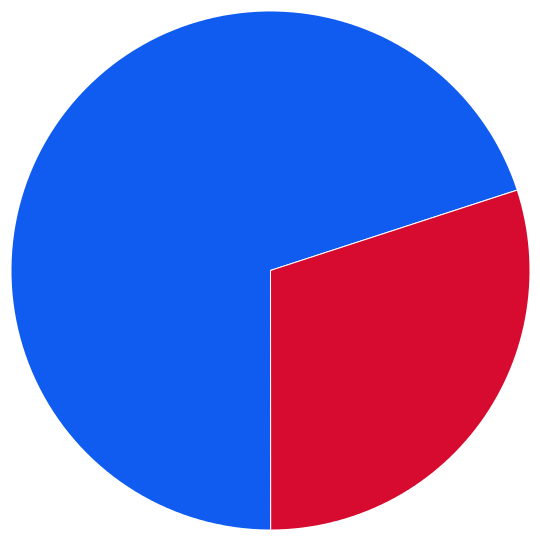
Do you pay attention to your local politics?
| Yes | No |
| Yes | No |
Map
| Yes | No |
| 70% | 30% |
| 423 Votes |
| 70% | 30% |
Gender
MF
72%
225

71%
96

Age
<2525-50>50
68%65%75%
68%
16

65%
88

75%
204

Income
<75k75-150k>150k
69%71%%
69%
73

71%
113
77%
92

Party
DemocratRepublicanIndependentLibertarian
77%74%71%74%
77%
48
74%
129

71%
98
74%
31
Alaska
(2 votes)
| 100% |
Alaska (2 votes) |
100% |
Alabama (4 votes) |
75% | 25% |
Arkansas (2 votes) |
50% | 50% |
Arizona (12 votes) |
75% | 25% |
California (38 votes) |
65% | 35% |
Colorado (11 votes) |
81% | 19% |
Connecticut (4 votes) |
75% | 25% |
Wash. D.C. (0 votes) |
100% |
Delaware (2 votes) |
50% | 50% |
Florida (24 votes) |
75% | 25% |
Georgia (7 votes) |
57% | 43% |
Guam (0 votes) |
100% |
Hawaii (0 votes) |
100% |
Iowa (1 votes) |
100% |
Idaho (6 votes) |
50% | 50% |
Illinois (5 votes) |
40% | 60% |
Indiana (15 votes) |
86% | 14% |
Kansas (4 votes) |
50% | 50% |
Kentucky (9 votes) |
88% | 12% |
Louisiana (0 votes) |
100% |
Mass. (5 votes) |
80% | 20% |
Maryland (4 votes) |
100% |
Maine (2 votes) |
50% | 50% |
Michigan (14 votes) |
71% | 29% |
Minnesota (6 votes) |
83% | 17% |
Missouri (2 votes) |
100% |
Mississippi (1 votes) |
100% |
Montana (0 votes) |
100% |
N. Carolina (9 votes) |
55% | 45% |
N. Dakota (0 votes) |
100% |
Nebraska (4 votes) |
100% |
N. Hampshire (2 votes) |
50% | 50% |
New Jersey (8 votes) |
75% | 25% |
New Mexico (1 votes) |
100% |
Nevada (2 votes) |
50% | 50% |
New York (8 votes) |
62% | 38% |
Ohio (17 votes) |
76% | 24% |
Oklahoma (3 votes) |
100% |
Oregon (11 votes) |
100% |
Penn. (9 votes) |
66% | 34% |
Puerto Rico (0 votes) |
100% |
R. Island (1 votes) |
100% |
S. Carolina (7 votes) |
85% | 15% |
South Dakota (1 votes) |
100% |
Tennessee (4 votes) |
50% | 50% |
Texas (33 votes) |
57% | 43% |
Utah (2 votes) |
100% |
Virginia (10 votes) |
100% |
Virgin Is. (0 votes) |
100% |
Vermont (0 votes) |
100% |
Washington (7 votes) |
85% | 15% |
Wisconsin (5 votes) |
80% | 20% |
W. Virginia (0 votes) |
100% |
Wyoming (0 votes) |
100% |
Last updated: 2026-02-10T15:13:25+00:00